If you've spent any time researching dividend ETFs, you've run into this comparison already. SCHD and VYM are the two most widely held, most frequently recommended dividend ETFs on the market and investors constantly ask which one is actually better.
The honest answer: neither wins outright. They're built on different philosophies, and the "better" fund depends entirely on what you're optimizing for. This article breaks down exactly where they differ, so you can make that call for your own portfolio instead of taking someone else's default answer.
Key takeaway: SCHD generally leans toward higher current yield and stronger recent total return through a smaller, quality-screened portfolio. VYM leans toward maximum diversification and the lowest cost, spreading your money across several hundred more holdings. Neither is "safer" in an absolute sense they're differently diversified.
Quick Answer: SCHD vs. VYM at a Glance
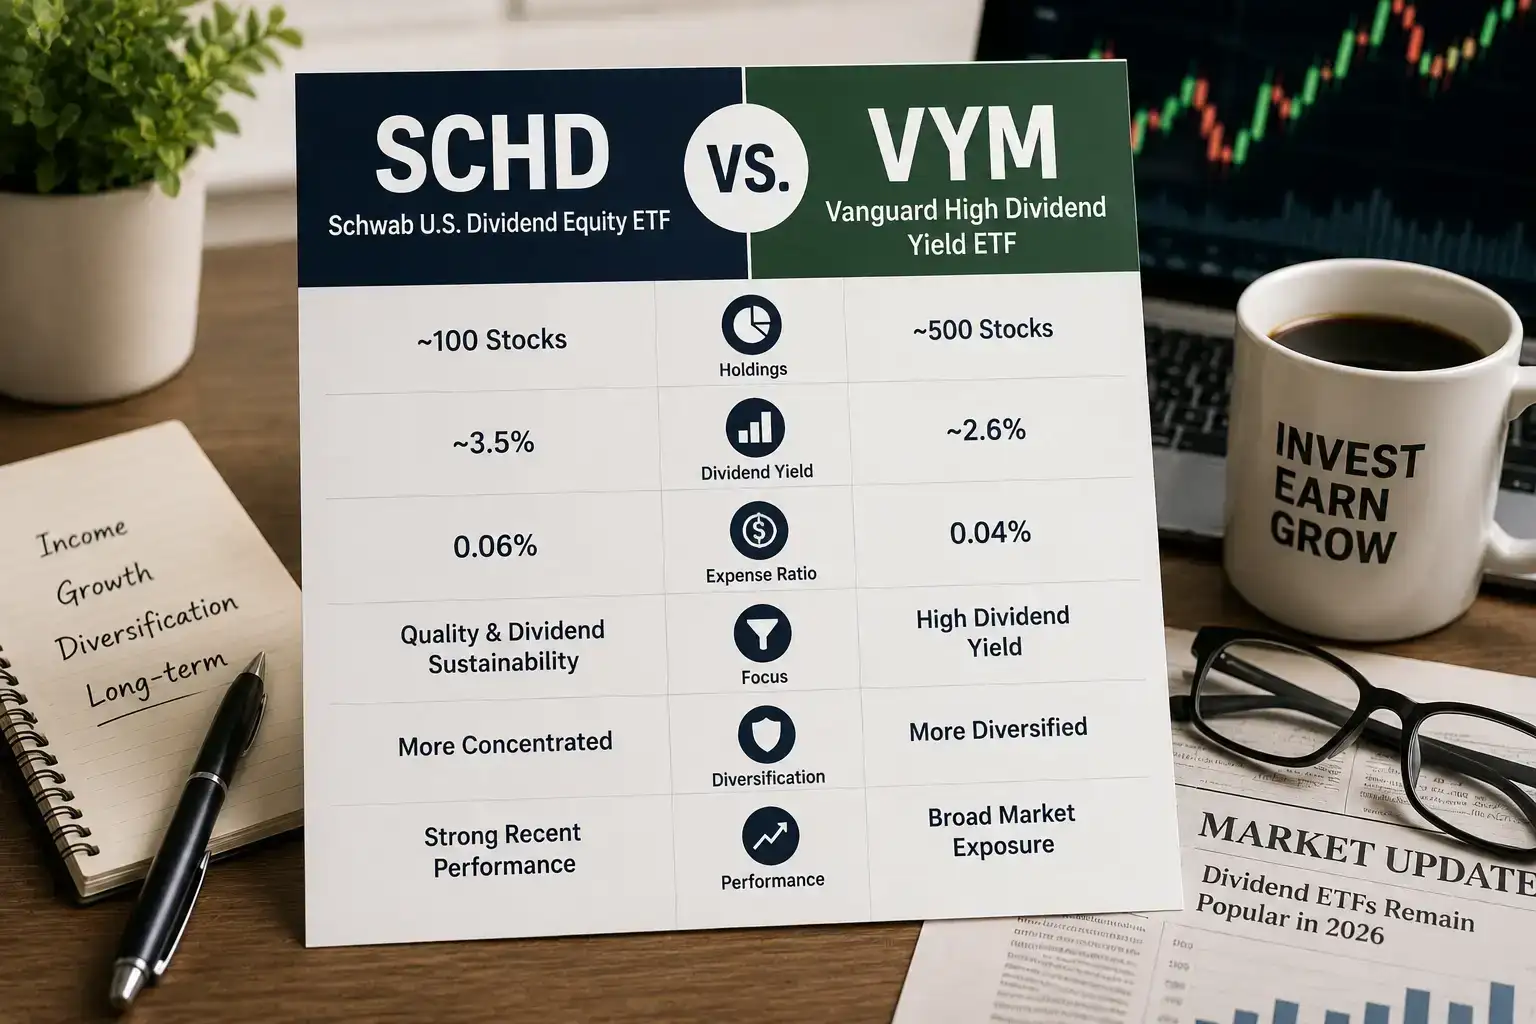
Feature | SCHD | VYM |
|---|---|---|
Issuer | Schwab Asset Management | Vanguard |
Tracks | Dow Jones U.S. Dividend 100 Index | FTSE High Dividend Yield Index |
Approx. Holdings | ~100–103 stocks | ~440–608 stocks |
Expense Ratio | 0.06% | 0.04% |
Selection Focus | Dividend quality & sustainability (10-yr history + fundamentals screen) | Broad above-average yield exposure |
Dividend Frequency | Quarterly | Quarterly |
Diversification | More concentrated, sector-tilted | Broadest of the two |
Historical Total Return Tendency | Recently stronger in several periods | Recently softer, but steadier breadth |
Figures reflect publicly reported approximate ranges as of mid-2026, gathered from Schwab, Vanguard, and third-party ETF data providers (TipRanks, ETF.com, ETF Database, The Motley Fool). Yield and return figures move regularly verify current numbers on the issuer's fund page before investing.
How Each Fund Actually Picks Its Holdings
This is the part most beginner comparisons skip, and it's the actual reason the two funds behave differently.
SCHD's Approach
SCHD tracks the Dow Jones U.S. Dividend 100 Index. To qualify, a company generally needs at least 10 consecutive years of dividend payments, then gets ranked by a composite score of cash flow to total debt, return on equity, dividend yield, and 5-year dividend growth rate. The result is a smaller, more selective portfolio roughly 100 companies weighted toward quality and sustainability rather than simply "highest yield available."
VYM's Approach
VYM tracks the FTSE High Dividend Yield Index, which takes a broader approach: it includes U.S. companies expected to pay above-average dividends, excluding REITs, and weights them by market capitalization. There's no explicit quality screen beyond that the index prioritizes breadth over selectivity, which is how it ends up holding several hundred more companies than SCHD.
Pro Tip: The name of an ETF tells you almost nothing about its actual strategy. Two dividend ETFs with similar-sounding names can track completely different indexes with different selection rules always check the underlying index methodology, not just the ticker's marketing description, before you buy.
Yield, Cost, and Return Compared
Dividend Yield
SCHD has generally carried a higher trailing yield than VYM in recent periods a byproduct of its tighter, quality-focused portfolio holding fewer, higher-yielding names. VYM's yield sits lower but comes with the tradeoff of holding a meaningfully larger, more diversified basket.
Expense Ratio
Both funds are considered best-in-class on cost. VYM has typically carried a very slightly lower expense ratio (around 0.04%) versus SCHD (around 0.06%). On a $100,000 investment, that difference amounts to roughly $20 a year not enough on its own to decide between the two funds, but worth knowing for the record.
Total Return
Total return leadership between the two has shifted period to period. In several recent stretches, SCHD's total return has outpaced VYM's, aided by its concentrated exposure to higher-quality names during periods when that quality premium was rewarded by the market. Over other stretches particularly ones led by broad mega-cap strength VYM's wider net has closed or reversed that gap. Neither fund has a permanent structural edge in total return; it depends on which parts of the market are leading.
Historical Performance Table
Metric | SCHD | VYM |
|---|---|---|
Approx. 10-Year Total Return | Roughly 220%–230% range (varies by measurement date) | Roughly 200%–210% range (varies by measurement date) |
Recent 1-Year Trend | Has recently outpaced VYM in several reported periods | Has recently outpaced SCHD in other reported periods |
Volatility Tendency | Somewhat higher due to concentration | Somewhat lower due to breadth |
Did you know? Both SCHD and VYM have meaningfully underperformed the broader S&P 500 over the past five years in several reported comparisons a reminder that dividend ETFs are generally built for income stability and lower concentration risk, not for beating a market-cap-weighted growth index.
Pros & Cons
SCHD
Pros
Quality screen filters out unsustainable "yield trap" companies
Historically strong combination of yield and total return
Well-established track record with an uninterrupted quarterly dividend history since inception
Cons
More concentrated (~100 holdings) a downturn in a top sector hits harder
Slightly higher expense ratio than VYM
Lower dividend growth rate than dedicated dividend-growth funds
VYM
Pros
Broadest diversification of the two several hundred more holdings
Lowest expense ratio among major dividend ETFs
Lower single-stock and single-sector concentration risk
Cons
No explicit quality screen some lower-quality, higher-payout-ratio names get included
Lower current yield than SCHD in most recent periods
Has trailed SCHD on total return in several recent stretches
Risk Comparison
Risk Factor | SCHD | VYM |
|---|---|---|
Concentration Risk | Higher (fewer holdings) | Lower (broader basket) |
Sector Tilt Risk | Moderate-to-high (energy, financials, healthcare tilt) | Lower, more broadly spread |
Dividend Cut Risk (portfolio-wide) | Lower quality screen filters for sustainability | Slightly higher no explicit sustainability filter |
Suitability for Volatility-Averse Investors | Moderate | Higher |
Can You Own Both SCHD and VYM?
Yes and it's a common approach. Because the two funds only partially overlap in holdings and follow different index methodologies, combining them in a portfolio can smooth out some of each fund's individual weaknesses: SCHD contributes yield and quality screening, VYM contributes breadth. There's no rule that says you have to pick exactly one dividend ETF, and a blended approach is a reasonable way to hedge the "which one is actually better" question rather than answering it.
Which One Should You Choose?
You want the highest reasonable current income with a quality filter → SCHD
You want maximum diversification and the lowest possible cost → VYM
You're risk-averse and prioritize smoothness over yield → VYM
You're comfortable with more concentration for a shot at stronger total return → SCHD
You don't want to choose → a blended allocation across both is a legitimate, common answer
This is general education, not a personalized recommendation for your account. Your tax situation, account type, and time horizon all affect which answer is right for you a fee-only fiduciary advisor can help you apply this to your specific numbers.
Frequently Asked Questions About SCHD vs. VYM
Is SCHD better than VYM? Neither is universally "better." SCHD has generally offered a higher yield and, in several recent periods, stronger total return, achieved through a more concentrated, quality-screened portfolio. VYM offers broader diversification and a marginally lower cost. The right choice depends on whether you prioritize yield/quality or maximum diversification.
Is VYM safer than SCHD? VYM's much larger holding count (400+ vs. ~100) does reduce single-stock and single-sector concentration risk, which some investors consider a form of safety. That doesn't mean VYM is immune to market declines both funds are equity ETFs and carry full stock-market risk.
Can I hold both SCHD and VYM in the same portfolio? Yes. Because their holdings only partially overlap, combining them is a common way to capture SCHD's yield/quality tilt alongside VYM's breadth, rather than choosing one exclusively.
Which has the higher dividend yield, SCHD or VYM? SCHD has generally carried the higher trailing yield in recent periods, a result of its more concentrated, higher-yield-weighted portfolio compared to VYM's broader basket.
Do SCHD and VYM pay dividends monthly? No both pay quarterly, not monthly. Investors looking for monthly dividend income need a different category of fund.
Key Takeaways: SCHD vs. VYM
SCHD and VYM solve different problems: SCHD optimizes for yield and quality within a smaller portfolio; VYM optimizes for breadth and minimal cost across a much larger one
Total return leadership between the two shifts by period neither has a permanent edge
Expense ratio difference (0.06% vs. 0.04%) is real but small enough that it shouldn't be your deciding factor alone
Combining both funds is a legitimate strategy if you don't want to choose one exclusively
Neither fund aims to outperform the broader S&P 500 both prioritize income stability and lower concentration over maximum growth
Financial Disclaimer & Regulatory Disclosure
This article is for educational and informational purposes only and does not constitute financial, investment, tax, or legal advice. FinanceFlows.site is not a registered investment advisor. ETF yields, expense ratios, holdings, and performance figures change frequently verify current data directly with Schwab Asset Management and Vanguard before making any investment decision. All investing involves risk, including possible loss of principal. Past performance does not guarantee future results. Consult a licensed, fee-only financial advisor or tax professional regarding your individual circumstances before investing.
References
Schwab Asset Management, SCHD fund profile and index methodology, schwabassetmanagement.com
Vanguard, VYM fund profile and index methodology, investor.vanguard.com
S&P Dow Jones Indices, Dow Jones U.S. Dividend 100 Index methodology, spglobal.com
FTSE Russell, FTSE High Dividend Yield Index methodology, ftserussell.com
ETF.com and ETF Database, third-party fund comparison data
IRS, Publication 550 (qualified dividend tax treatment), irs.gov
Note for editorial team: pull exact current-day yield, holdings count, and total-return figures directly from Schwab's and Vanguard's live fund pages immediately before publishing this draft's figures reflect data gathered in July 2026 and shift regularly.
Related Financial Guides & Tools
📊 Related Tool: To project how quarterly distributions and dividend reinvestment plans compound your share count over a 10-year holding period, run the numbers through our dividend income and DRIP calculator. While a two-basis-point difference in management fees sounds negligible, you can calculate the lifetime cost of fund expense ratios on our ETF return and expense ratio calculator.
🌱 Model Your SCHD or VYM Returns with DRIP
Enter your portfolio value, ETF yield, monthly contribution, and dividend growth rate to see how your passive income scales over 20 years with reinvestment.
Dividend DRIP Calculator → ETF Fee Drag Calculator →Frequently Asked Questions: Schd vs vym
What is schd vs vym and why does it matter?
Schd vs vym provides crucial financial direction for investors and households. Understanding schd vs vym helps you make informed allocation choices, reduce unnecessary fees, and optimize your overall returns.
How can you apply schd vs vym in your financial strategy?
To implement schd vs vym successfully, start by assessing your current risk profile and timeline. Consistently monitoring schd vs vym ensures your portfolio stays aligned with long-term goals.
What are common pitfalls to avoid with schd vs vym?
The most common mistake when evaluating schd vs vym is reacting to short-term market noise. Focus on verifiable data, compound growth, and proven principles when making decisions based on schd vs vym.